One of the best tools for coffee professionals needing to analyze their coffee, equipment and/or staff is the Coffee Brewing Control Chart. It is a great teaching tool in your coffee shop or roastery for training and development.

The one page form may look simple yet many variables converge in a small area making the use of the form difficult to understand for anyone who has never attempted it before.
Below you will find the three simple steps to using the form as well as three simple ways to correct your brew if you are not achieving the ideal extraction with your coffee and equipment.
What you need:
• A cup of coffee brewed to the specifications of the equipment you used to brew and the recipe (amount of coffee grounds and water used) recorded.
• A TDS meter (link to wiki here).
• A Coffee Brewing Chart. The chart we are using here is a grams/liter chart made by the Specialty Coffee Association of Europe, SCAE (Now the Specialty Coffee Association, SCA).
Vocabulary:
• Strength - refers to the measure of solubles present in the beverage and usually expressed as a percentage of the flavoring material to water.
• Extraction - or sometimes refers to as "solubles yield" - refers to the amount of solubles extracted from the bean itself and also expressed as a percentage.
• Brew formula - refers to the ratio of water used per quantity of coffee.
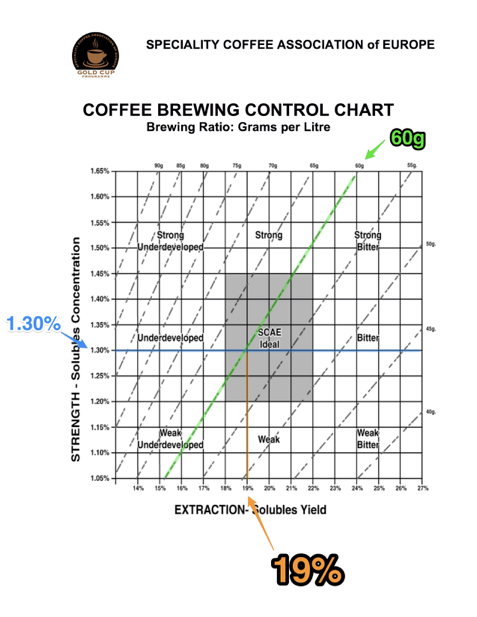
Step 1
(Highlighted in green) From the diagonal lines on the chart, find the one that represents your coffee to water recipe.
Each diagonal line has a weight in grams on the top/right side of the line.
This means if you brewed 30 grams of coffee with 500ml of water you would double the number to find the line that says 60 grams because the chart is based off of 1 liter of water.
Step 2
(Highlighted in blue) Once your coffee has cooled down you can place a few drops of coffee in the sense of the TDS meter to measure the Total Dissolved Solids in the coffee.
This is your strength/concentration.
A cup of brewed coffee is 98-99% water.
Even the slightest various will impact body, flavor and aroma.
Once the TDS gives you a reading. Find the horizontal line that represents that number.
Step 3
Find where your brew ratio line (diagonal) and intersects with the concentration line (horizontal).
At the place where they intersect follow the vertical line all the way down the chart to find the extraction percentage.
According to research performed by Dr. Lockhart of the Coffee Brewing Center in the United states in the 1950’s and 1960’s, the chart made by the Specialty Coffee Association highlights the optimum brew having a 1.15 -1.35 concentration and a 18-22% extraction.
The chart you see above is made by the SCA and uses the same extraction (18-22%) whilst opting for a slight stronger body of 1.20 - 1.40% strength. It is safe to say different cultures and markets might slightly vary in their preference of coffee strength however the extraction of 18-22% remains the same.
This chart is only meant to provide a general target area for a specific coffee’s ideal brew but every coffee may perform differently and reach full potential in a different location on the chart.
Three step corrections: (Assuming your are brewing coffee correctly according to your brew equipments instructions with a water temperature of roughly 93℃ for approximately 4 minutes.)
Problem 1: Your brew ratio is too strong or too week and will not fit on a diagonal line (highlighted in green) that cuts through the ideal brew shaded box in the center of the chart.
Correction: Change your recipe to match one of the correct lines.
Problem 2: Your strength is greater than 1.40% Total Dissolved Solid or your Soluble Yield (extraction) is higher than 22%.
Correction: Adjust you grind size coarser, brew again and retest.
Problem 3: Your strength is less that 1.20% Total dissolved solids or your Soluble Yield (extraction) is lower than 18%.
Correction: Adjust your grind size finer, brew again and retest.

The chart you see above is made by the SCA and uses the same extraction (18-22%) whilst opting for a slight stronger body of 1.20 - 1.40% strength. It is safe to say different cultures and markets might slightly vary in their preference of coffee strength however the extraction of 18-22% remains the same.
This chart is only meant to provide a general target area for a specific coffee’s ideal brew but every coffee may perform differently and reach full potential in a different location on the chart.
Three step corrections

(Assuming your are brewing coffee correctly according to your brew equipments instructions with a water temperature of roughly 93℃ for approximately 4 minutes.)
Problem 1:
Your brew ratio is too strong or too week and will not fit on a diagonal line (highlighted in green) that cuts through the ideal brew shaded box in the center of the chart.
Correction:
Change your recipe to match one of the correct lines.
Problem 2:
Your strength is greater than 1.40% Total Dissolved Solid or your Soluble Yield (extraction) is higher than 22%.
Correction:
Adjust you grind size coarser, brew again and retest.
Problem 3:
Your strength is less that 1.20% Total dissolved solids or your Soluble Yield (extraction) is lower than 18%.
Correction:
Adjust your grind size finer, brew again and retest.
